
As a Data Scientist at Precision Analytics, I have had the good fortune to meld my background in epidemiology and biology with …

Bad habits I shed when I started working alongside software developers
At Precision Analytics, many clients we work with in the biopharmaceutical sector find web applications extremely useful: from uploading or inputting raw data into the browser, visualizing plots, seeing results of statistical analyses re-run in real time and exporting manuscript ready reports. Our workhorse tool to deliver this value is R Shiny.
With training in R from my epidemiology and biostatistics background, it was simple enough to begin using Shiny. I initially began with fairly simple dashboards with a few inputs and basic interactive visualizations. I was later onboarded to a much larger project being led by developers with computer science backgrounds. Unlike all the dashboards I’d seen in the past, this one required user login credentials, user groups, the retrieval of many data sources, and functionality such as data input, upload and validation, database storage, and machine learning analyses.
When I first began working on the new app, I felt like a fish out of water. Everything seemed confusingly complicated. It took some time to adapt, and collaborating with software developers meant a big shift in my workflow. But now, after years of working with and learning from developers, my approach to any project has fundamentally changed.
Here are a few things that have stuck with me along the way.
Before joining the new Shiny team, I was already familiar with the basic use of project management and version control software but I had typically been working solo or with another data scientist on a project. The issues were broad, my commit messages were one-liners, and I sometimes only opened a pull request at the end of my project. My philosophy had always been to get things done well and fast. I wasn’t one to fuss.
Well, using proper styling guidelines, thoughtfully breaking up tasks into issues, properly using branches, pull requests and code review, and writing informative commit messages (among other things) seemed if not fussy then a lot of effort to me. It took loads of time and I disliked how it slowed my progress.
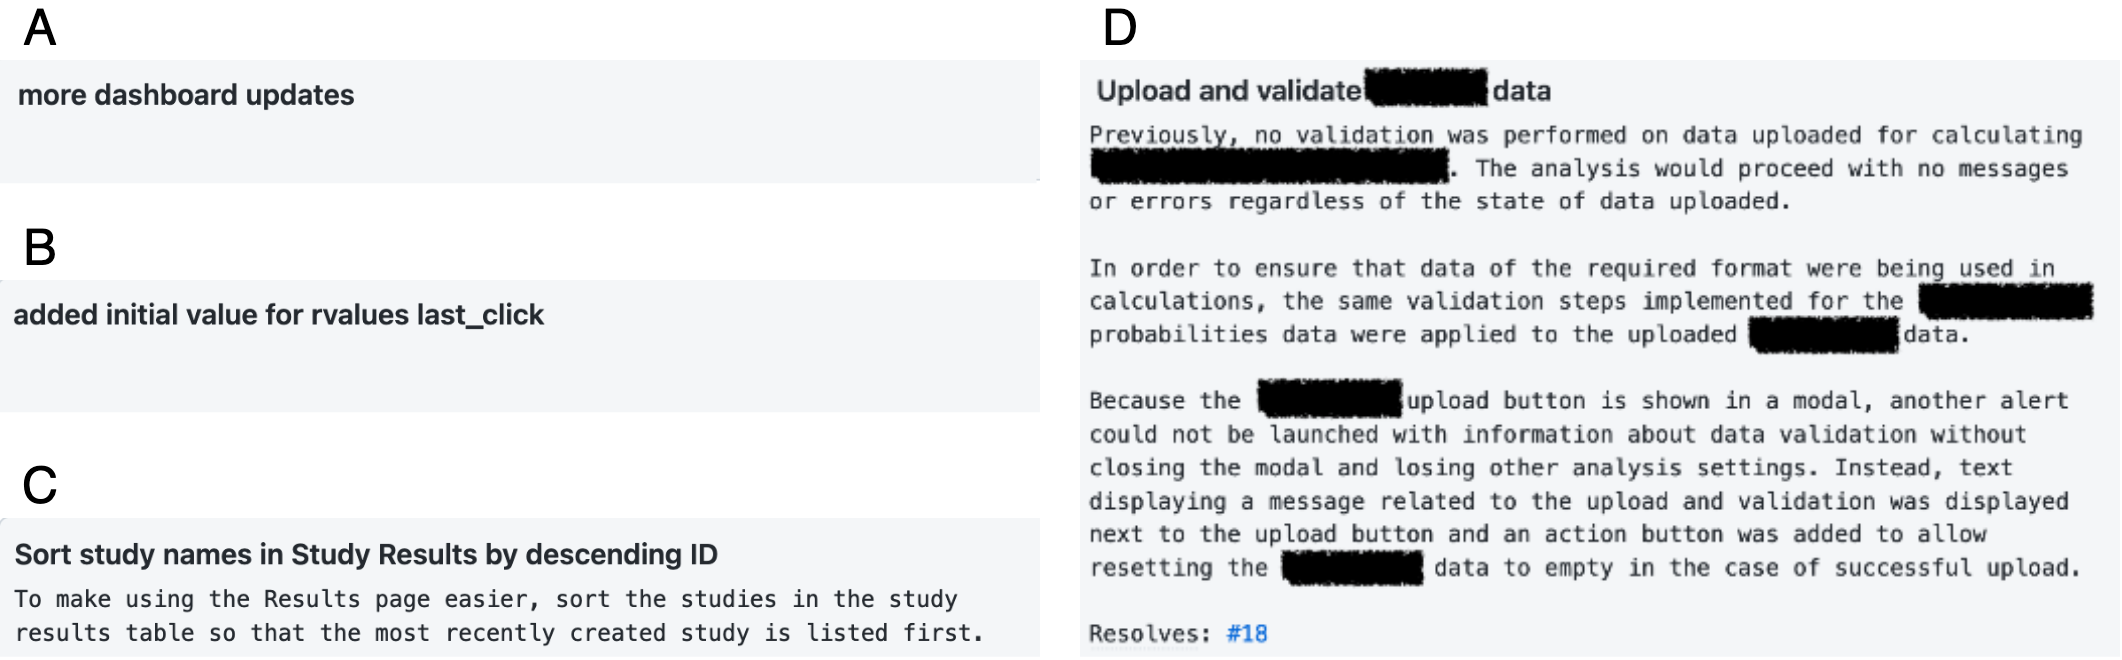
Fig 1. Panels A through D show the evolution of my commit messages from short and uninformative in Panel A to a full commit message in Panel D with title, description, and reference to the issue number. A commit message such as those in Panels A and B might take a few seconds to write; it might take a minute or two to write the message seen in Panel C; a properly constructed commit message in Panel D could take me as long as 15 minutes to write. Some portions of the commit message in Panel D have been redacted due to client confidentiality.
Eventually I realized that while I knew how to write methodologically sound, reproducible code, it wasn’t particularly readable code. Analysis projects often need scripts to be run once to produce output and are possibly revisited for revisions once or twice. In contrast, software scripts for R Shiny may need to be revisited frequently, bugs crop up and must be addressed, features need to be added or adjusted. Anyone has to be able to open a script they’ve never seen before and be able to understand and use it.
Similarly, it took me some time to realize that commit messages and pull request descriptions were not for my benefit but for the benefit of those reviewing my code. They were there to give context to the changes I pushed – specifically the why as opposed to the what or how.
Altogether it clicked, following all these guidelines was about communicating with myself and the team – past, present and future.
As Shiny apps or statistical analyses get more complicated, so will that one giant script holding it all. Our CEO, Erika Braithwaite, affectionately refers to this situation as a mixed-up pile of spaghetti.
The first few Shiny apps I made were so basic the entire app fit on a few hundred lines. Then I started experimenting with more features, adding tabs and menus. Suddenly my app file was thousands of lines long. I have even seen some Shiny scripts that are tens of thousands of lines long. It’s impossible to find anything in all that spaghetti.
So, let’s make lasagna instead. Without taking the analogy too far, a lasagna is a carefully planned dish, with precisely placed layers all coming together to make something beautiful.
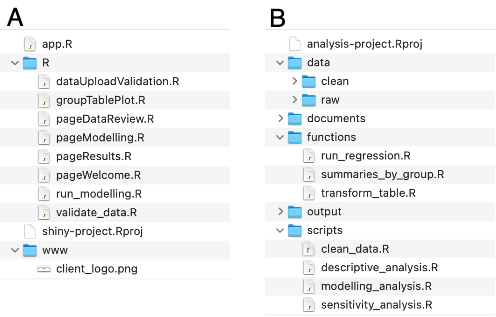
Fig 2. Organization of files for an example Shiny project in Panel A and an example statistical analysis project in Panel B. In the Shiny project, Shiny modules, named using camel case, and functions, named using snake case, are saved in the R directory which is automatically sourced when the app is launched. The analysis project separates documentation, data, scripts, functions, and output into separate directories.
Now when I work on a Shiny app, I like to have a clean, short app file, with separate files for different sections of the app. I use Shiny modules to contain an app page, or even just a section of a page depending on the complexity.
Similarly, in a statistical analysis project, I use separate scripts for data import and cleaning, descriptive analyses, regression analysis, producing different types of output, and for functions. I also have separate directories for data, scripts, and output.
Of course, I started out repeating code. Need 10 similar inputs? Repeat the code 10 times with slightly different input IDs. That’s not so bad. What about five plots showing the same thing but each for a different group? Now you have not only repeated code in your UI but a significant amount in your server as well.
There are several issues associated with repeated code.
- It opens the door to copy and pasting errors. For example, forgetting to change the axis title on the fourth of five plots.
- It multiplies the script length making it both less readable and more difficult to locate a particular element.
- It makes finding the source of an error difficult. Is it all or one of these repeated code chunks causing the error?
- And it makes updating a feature more error prone. Did you get them all? In the UI? In the server?
As a team working on a Shiny app, we agree on a design implementation plan to eliminate code repetition and use functions and modules as much as possible to reduce code length.
In a statistical analysis project, I usually begin by strictly coding the steps as I need them. As I find myself writing repeated or similar code, I will allow myself a little time to write up a few functions to help me along the way. These functions typically have few parameters and are not terribly original. But they clean up the code, speed up the analysis, and reduce copy-pasting errors.
Reducing the use of repeated code takes some forethought: mapping out the requirements and breaking down the functions I’ll need is an upfront investment that will pay itself in dividends along the day.
Writing documentation is not my idea of fun. In fact, sometimes I dread it. It’s hard to write a perfectly succinct but informative description. But those functions and modules1 that I love so much - that are so helpful with eliminating repeated code and making scripts more readable - become exactly the opposite when no documentation is included.
With no function documentation, the script becomes completely opaque. It may look clean and efficient but it’s no longer readable.
At the very least when working on a statistical analysis project, I always thank myself or my colleagues later for a well-documented function that provides an overall description of the function purpose, and an explanation for each function parameter. Extra helpful are a description of the return object and examples of usage.
Style guides generally give a description of appropriate function documentation, such as the tidyverse style guide for documenting packages , and I’ve learned to follow them as closely as possible when working on a Shiny project.
Working with software developers has taught me so much. I now truly appreciate the virtues of clean legible code broken down into meaningful parts, and making sure that “future me” doesn’t hate “past me” for telling myself “I don’t need to document that decision, I’ll definitely remember my reasoning in six months” or “that function is so obvious how to use, I don’t need to define each parameter”. It was a lot of effort but I’m so thankful that I did it and for the gentle guidance I’ve had over the years that got me where I am today.
Find out more about our R training courses by contacting us at contact@precision-analytics.ca !
A software application, at its simplest, is something that you can see and interact with - what we call the user interface (UI) - with accompanying actions that are controlled behind the scenes in what is called the backend (or the server in Shiny apps). A Shiny module is a set of two linked functions where the first, called the UI function, produces the something you see and the second, called the server function, produces the actions that occur when interacting with the UI function elements.
A module can be reused any number of times within the same application, e.g., a drop down menu and plot where the plot updates when a different selection is made from the menu. Or a module might only be used once, e.g., to contain a page or complicated section of a page in order to spread code across multiple scripts. For more information and examples about modules, check out the official Shiny modules page . ↩︎