
I am a Masters student in Epidemiology at McGill University. In summer 2017, I did an internship at Health Canada, where I developed …
Explore messaging patterns on Facebook
You can download your facebook message history from your personal account, under Settings. Click on Download a copy of your Facebook data. In the zip file, you will get all the photos, messages and posts you have sent in the past. All messages are stored under the folder Message as html files. Each html file is a chat history with a person or group.
I parsed the html file with R package rvest
and organized the data into a
data frame with 3 variables: user, timestamp of a message and message text. For
the purpose of illustration, I extracted about 6-month of chat history with a
friend of mine.
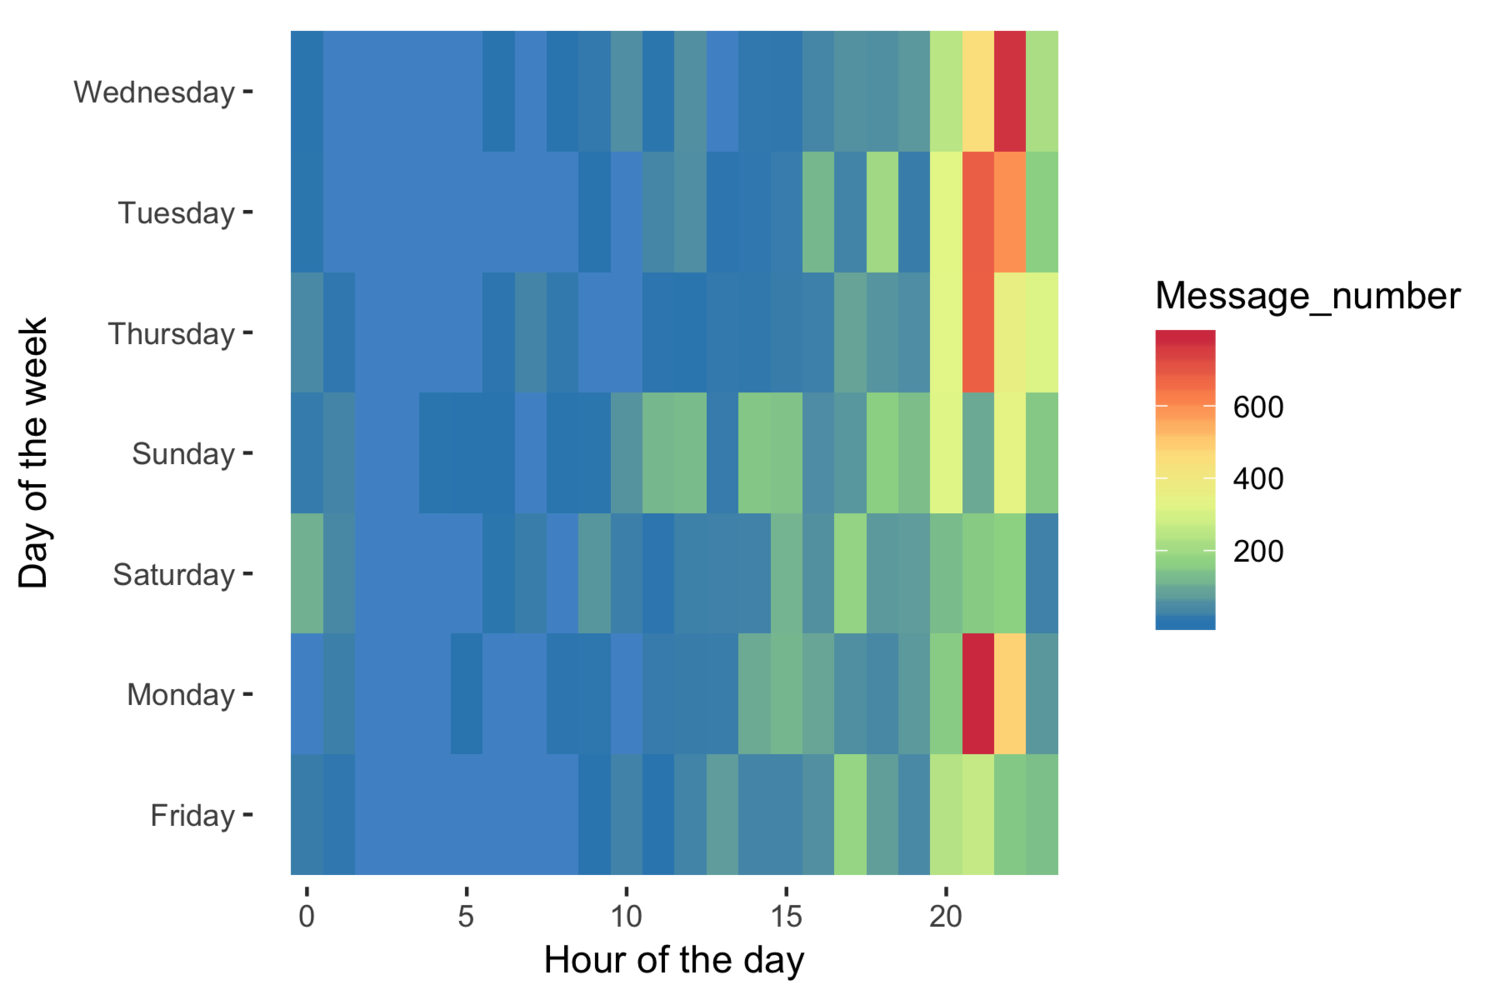
The first question I was interested in was ‘When did I message my friend most often’. To do this, I made a tile plot. As expected, we tend to message each other during weekday evenings after school. A perfect example of some procrastination.
The next questions I’d like to answer are: who usually initiates a conversation? How often do we talk? I defined the start of a day as after 7 am, since I didn’t want to mistakenly count any conversations past midnight as the first conversation of the day.
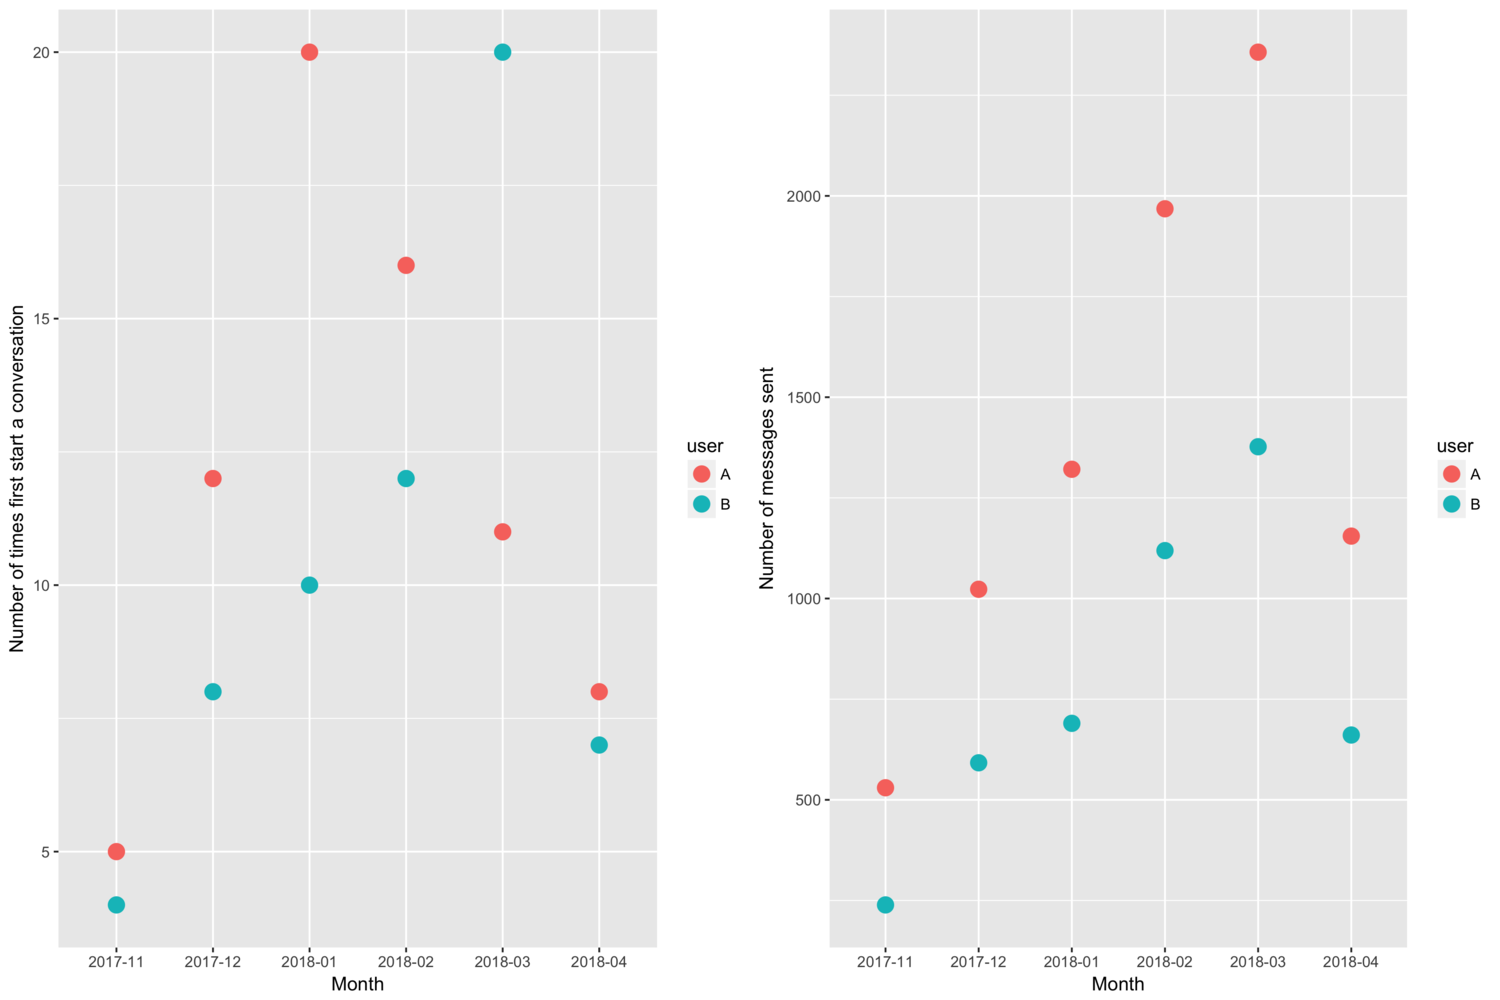
From the dot plot, the friendship seems to be going strong. We really enjoying exchanging messages. Now let’s do a quick analysis of the text content.
To do this, I used the tidytext
package in R. Before breaking each message
into single tokens (a token is a meaningful unit of text), I first needed to
clean up some messages, which involves removing meaningless symbols, any links
and system messages. Then, using the unnest_tokens() function
I transformed
the data frame into a ’tidy’ format, that is, one word per row. Stop words are
words that are not useful for an analysis. Words such as “the”, “of”, “to”, and
so forth in English are typical examples of stop words. There is a pre-built
library of stop words within tidytext package, which makes removing them super
easy.
After organizing messages into a tidy format, I looked at word counts and visualized them in plots.
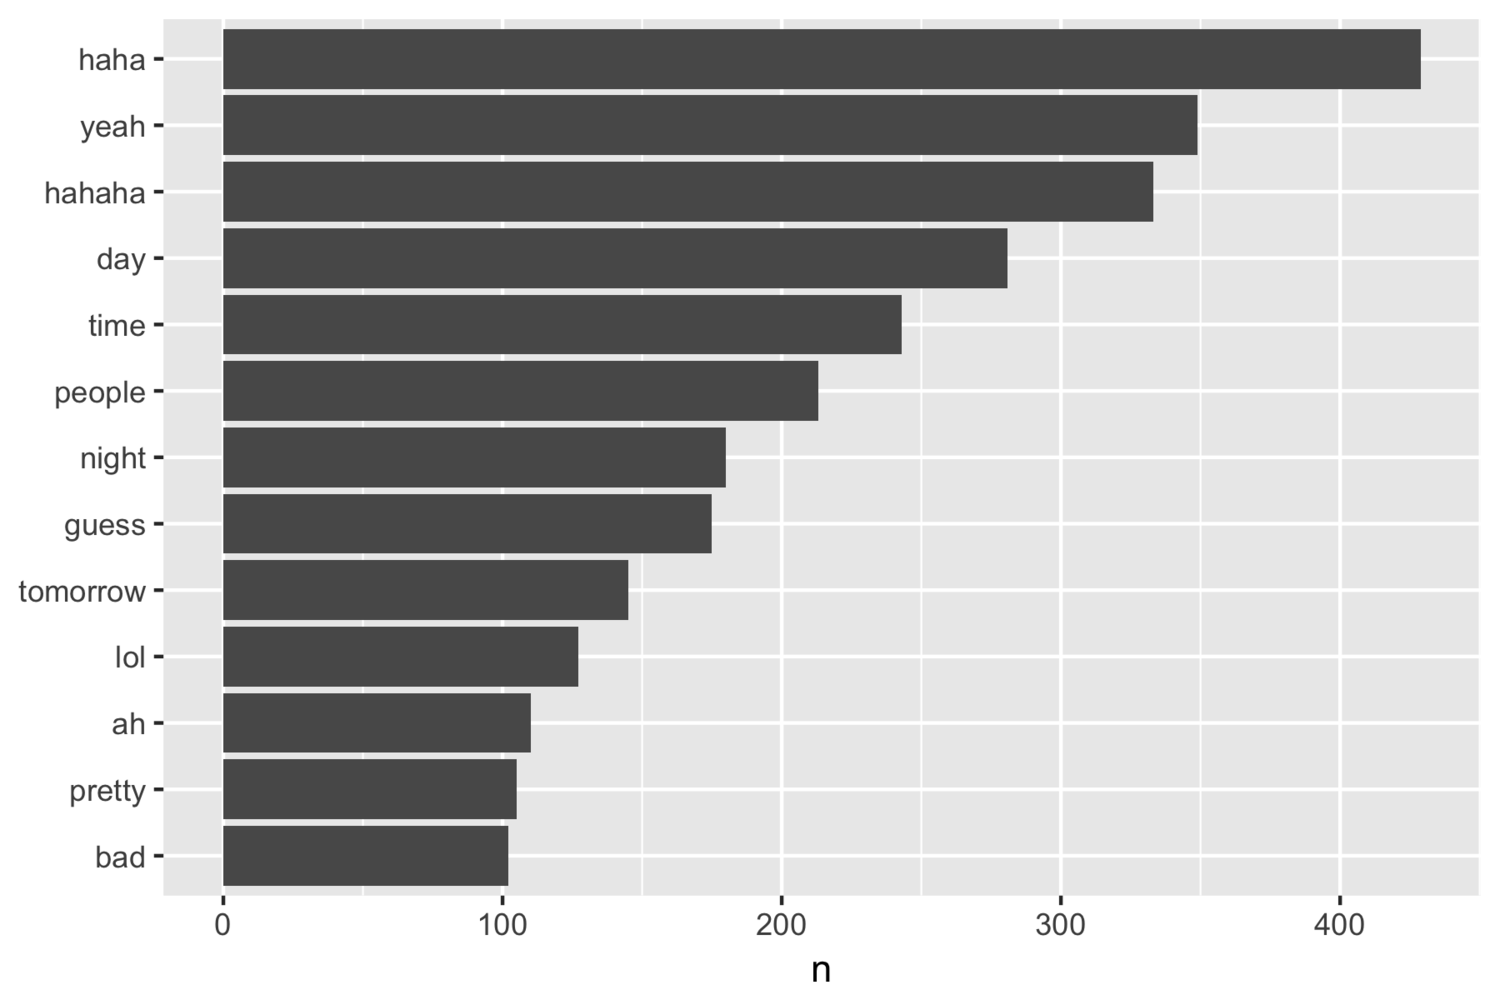
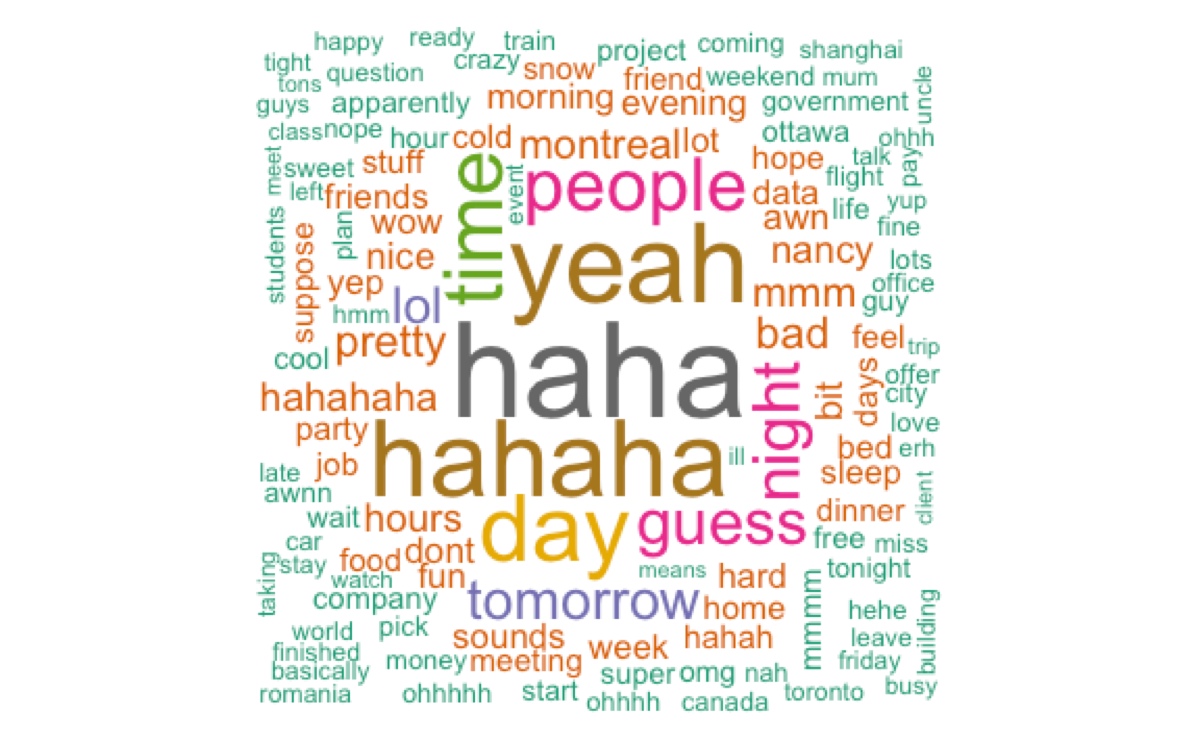
Just a quick glimpse, the conversations were certainly not very intellectual, dominated by words like ‘haha’, ‘hahaha’. Proof of procrastination again! Usually, for text mining, people will continue with sentiment analysis, topic modelling, and examining correlation between words. As a beginner in this area, I am still exploring these methods. I’d highly recommend the book Text Mining with R as a perfect resource to tackle into this field.
As you can see, it doesn’t take too much work to explore your Facebook messages and it is always fun to see some hidden trends.
Find out more about our R training courses by contacting us at contact@precision-analytics.ca !