
I obtained my bachelor’s and master’s in psychology and then completed a PhD in Epidemiology at McGill University. My journey …
Visualizing makeup data using R
Anyone who knows me knows that I love makeup. It’s a strange addiction that I can’t quite explain: the artistry, the colors, the smells – I adore it all. So when I randomly stumbled across a makeup API , I could not help but play with the data!
Restricting my analysis to some of the most common brands found in Canadian
drugstores, I ended up with 194 products from 10 different brands. The data
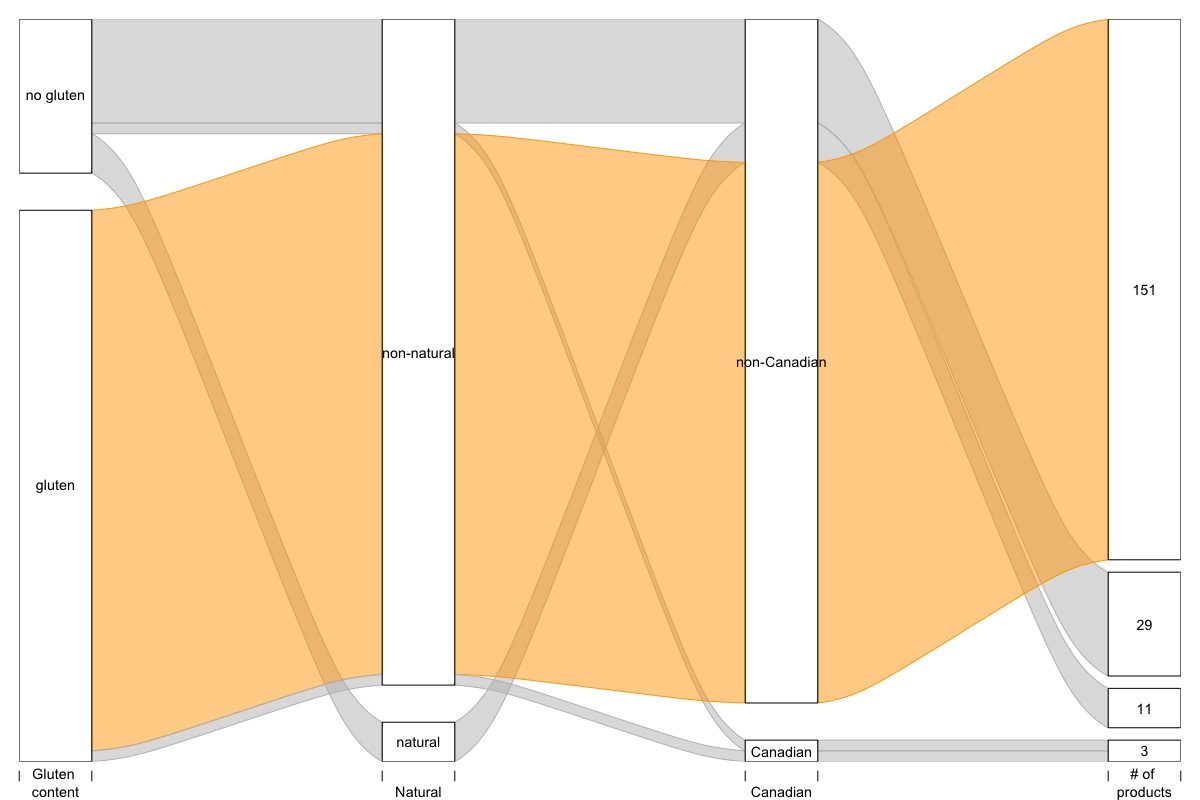
contained tags indicating whether a product was 1) Gluten free, 2) Natural, and
3) Canadian. I used R’s alluvial package
which is useful for plotting
categorical data.
From the plot below, we can see that from the brands included in my analysis, most (151/194) were gluten-full, not natural and non-Canadian! Please note – I have no thoughts and feelings about how much gluten should or shouldn’t be in your makeup, or how Canadian it should be.
Next I wanted to look at makeup ratings by brand. Since most of the brands were considered low- to mid-range in terms of price, I was curious to know whether there would be variability across brands. I did not have access to higher end brands like Dior or Guerlain, but my guess is that price is often conflated with quality since it is easy to assume that paying more ensures a better product. I have a great deal of thoughts and feelings about that theory. For an in-depth discussion about the ‘value’ of high end makeup, please contact me directly at erika[at]precision-analytics.ca.
I plotted ratings against price in order to see how brands compared using
Plot.ly’s ggplotly() function
. Splitting the plot area into quadrants gives
me a rough sense of how brands “cluster” together.
Unable to successfully load Plotly.
Clicking on each brand in the legend allows us to select which brands to display in the plot. Wet n’ wild and revlon are clear winners in terms of price and ratings, physician’s formula showing a lot of variability across ratings and price. Since there were so many data points, even having a beautiful, clickable interactive plot didn’t tell me which brands demonstrate the best value. Stay tuned for next week’s post where I use k-means clustering to have more fun with this data!
Find out more about our R training courses by contacting us at contact@precision-analytics.ca !