I am a Masters student in Epidemiology at McGill University. In summer 2017, I did an internship at Health Canada, where I developed …
Visualizing US FDA adverse drug events
An adverse drug event (ADE) is an unintended and harmful response to a medication from a patient. It poses a significant burden on the health care system and leads to increased loss of life.
According to the U.S. Department of Health and Human Services, ADEs account for an estimated 1 in 3 of all hospital adverse events and affect about 2 million hospital stays that last from 1.7 to 4.6 days each year. What’s worse, studies have shown that ADEs are often under reported depending on the type of drug and type of ADEs. Hence, the true impact of ADEs is likely larger than estimated.
Analyzing available ADE data is one of the most common ways to detect potential ADEs early following drug approval.
The dashboard presented here aims to provide an interactive descriptive analysis using data from the U.S. FDA Adverse Event Reporting System (FAERS) . It was developed using the R Shiny package.

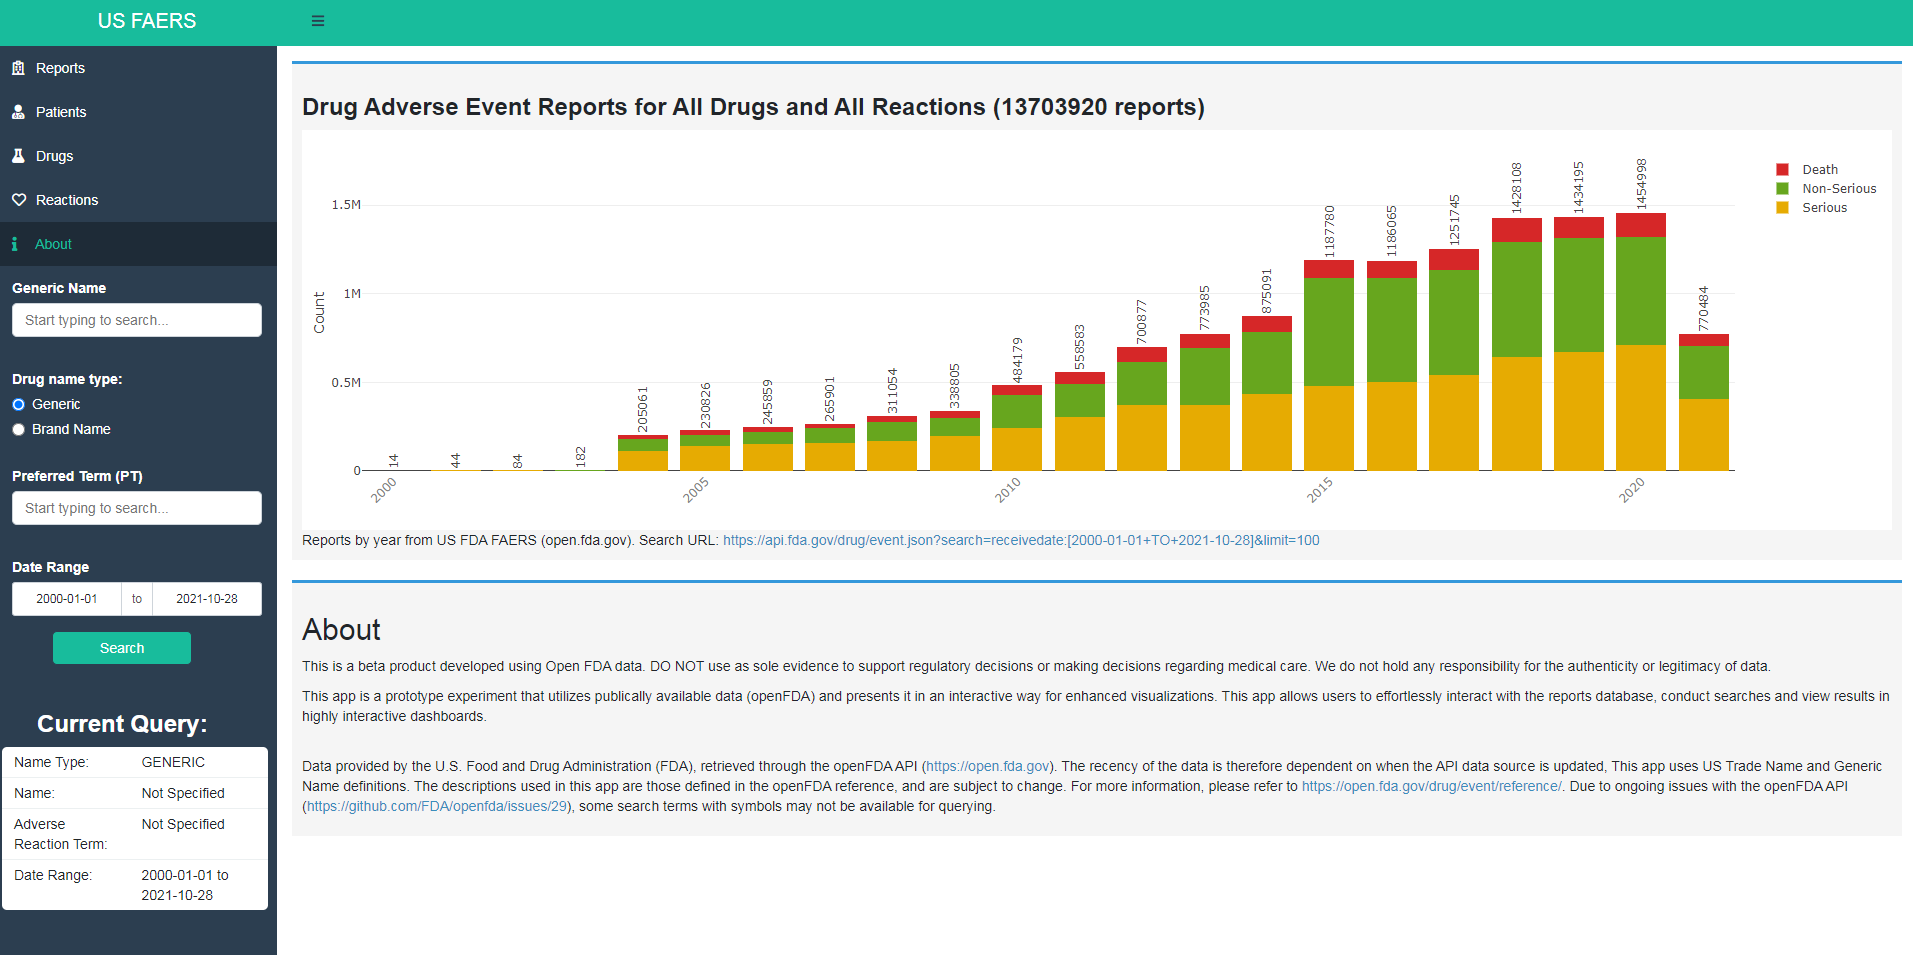
Fig 1. A screenshot of the dashboard prepared in order to provide simple and interactive descriptive analysis using the U.S. FAERS database.
It has 4 panels on the left: Reports, Patients, Drug and Reactions. Users can also define search criteria such as drug brand/generic name, preferred term(s) of ADE and time limits of the ADEs.
The main plot on the right shows the number of ADEs reported over time subdivided by seriousness of the event(s).
The Reports tab provides an overview on who the reporters were for the ADEs, whether the reported ADE(s) were serious or not, reason(s) for seriousness and which country the ADEs were reported in. The Patients tab presents demographic information such as gender and age on people affected in the ADEs. The Drug tab takes a look at the class of drugs in all ADEs. And lastly, the Reactions tab shows the most common adverse events and outcomes from ADEs.
Overall, the dashboard enables users to explore reported ADEs from certain medication(s) with a few mouse clicks. Although the information from those basic graphs does not provide concrete evidence on association between certain medication usage and outcome(s), it serves as an entry point to more thorough downstream studies.
In the last part of this blog, I’d like to briefly talk about the tools used to build the dashboard.
Shiny is an R package that provides an easy-to-learn and powerful framework for building web applications. As someone who does not have any previous experience in web development tools such as HTML, CSS or Javascript, I was able to quickly develop prototypes of interactive web applications entirely in R!
More interestingly, there have been very active developments in shiny extension packages, such as:
… just to name a few.
It is so much fun to keep up with those new developments and apply them to your next project!
The openFDA drug adverse event API returns data from the FAERS database . Instead of maintaining and keeping FAERS data on your own server, it is free to access all ADEs reported to the FDA since 2004 using the API. That certainly saves a heck of time and resources on my own to figure out a data pipeline. In addition, backed by ElasticSearch, the openFDA API has quite impressive query performance, which certainly helps to make the shiny application more responsive.
Find out about our R training courses by contacting us at contact@precision-analytics.ca !
