I am a Masters student in Epidemiology at McGill University. In summer 2017, I did an internship at Health Canada, where I developed several R shiny applications for interactive visualization of the Canada Vigilance Adverse Reaction Database. The experience motivated me to explore more in big data, data visualization and data mining. With open-source communities, there are endless learning opportunities in this field and I am thrilled to be part of the journey!

Nancy Zhu
October 24, 2021
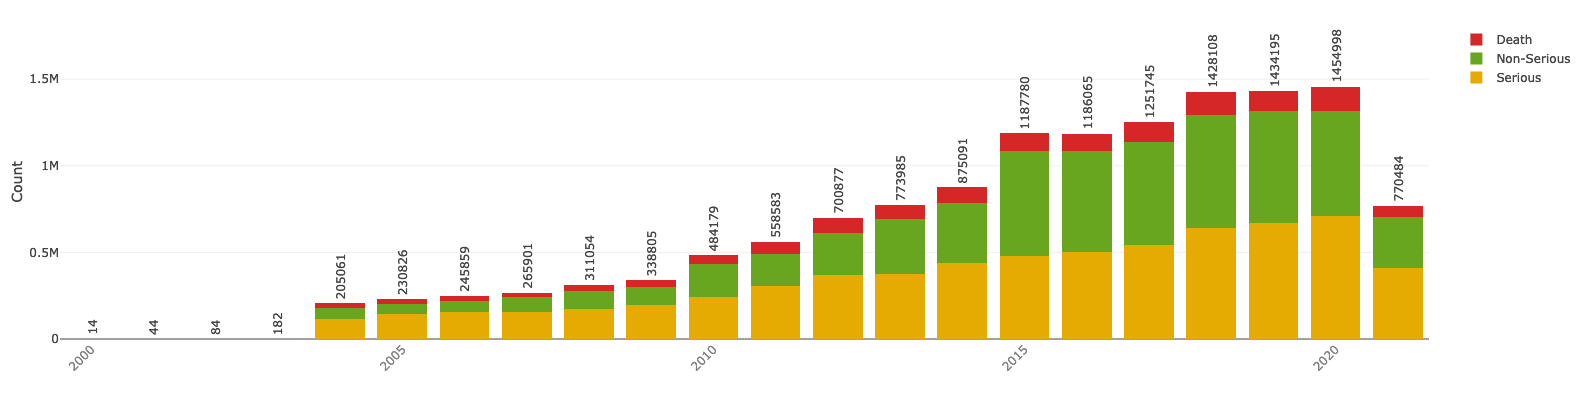
Visualizing US FDA adverse drug events
Leveraging R Shiny to create a dashboard presenting a brief report for adverse drug events in USA
Read More
March 15, 2021
April 26, 2018
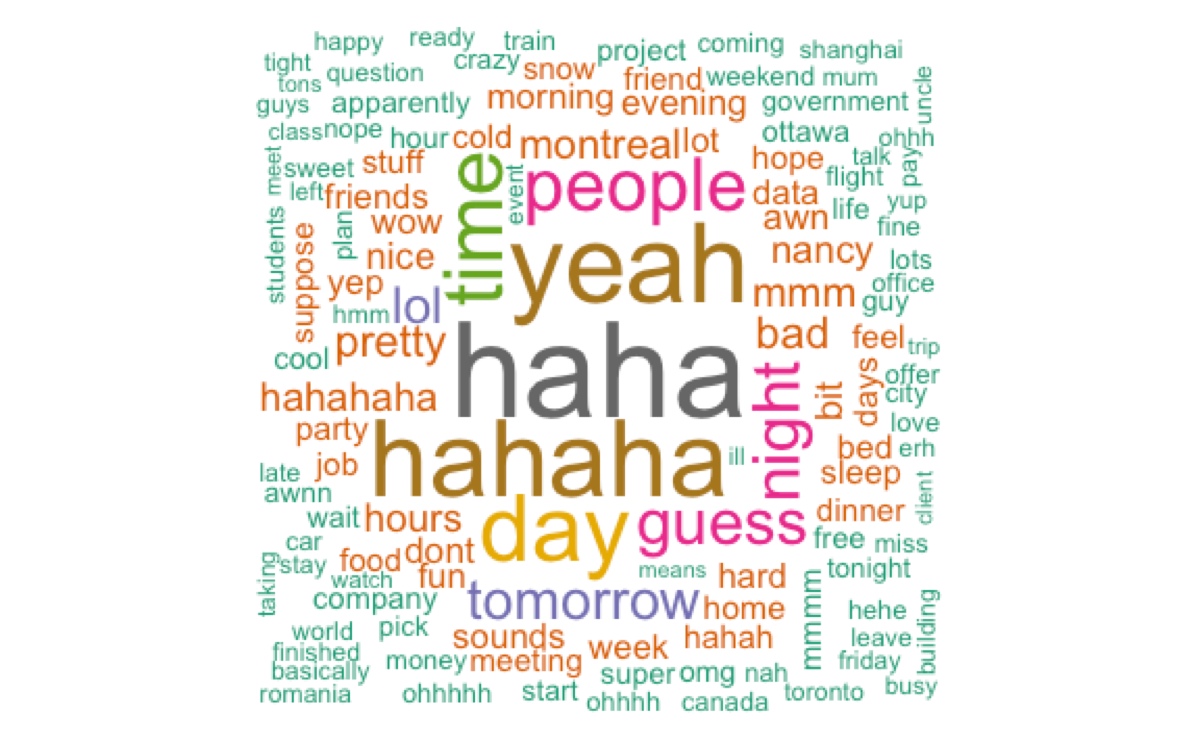
Explore messaging patterns on Facebook
Analyzing my Facebook message history with rvest and tidytext